A strategic partner to design, manage and optimize your marketing campaigns
R-Advertising brings the expertise of a media agency and the agility of a consultancy to help you build and optimize your digital acquisition strategies.
From media planning to activation of performance-based channels, we support you at every stage to maximize your results and grow your brand visibility.


Our expertise in digital marketing and commerce
Boost your brand awareness, drive qualified traffic or generate engaged leads: we design tailor-made digital strategies by activating the right channels to meet your goals. Through an omnichannel approach, we ensure effective reach and continuous performance optimization.
Run your acquisition campaigns via email, SMS, and RCS, using our proprietary and qualified contact databases. Thanks to our in-house media network and a strong network of publishing partners, we provide access to millions of opt-in profiles.
- A reach of several million contacts
- Acquisition campaigns via email, SMS and RCS
Engage your target audience through powerful formats and precise targeting, leveraging programmatic advertising and digital platforms.
- Multi-device programmatic delivery (desktop, mobile, tablet)
- Campaign performance management
Make full use of your data to improve the performance of your campaigns by collecting new qualified contacts and optimizing your existing database.
- Custom GDPR-compliant solutions
- Solutions to collect, enrich or re-engage
Expand your visibility with offline activations and partnerships.
- Tailor-made solutions
- Strong presence beyond digital
Leverage committed influencers and strategic platforms to boost your visibility and maximize conversions.
- Brand awareness and conversion campaigns
- Carefully selected partner networks
Acquisition campaigns via email, SMS and RCSA reach of several million contacts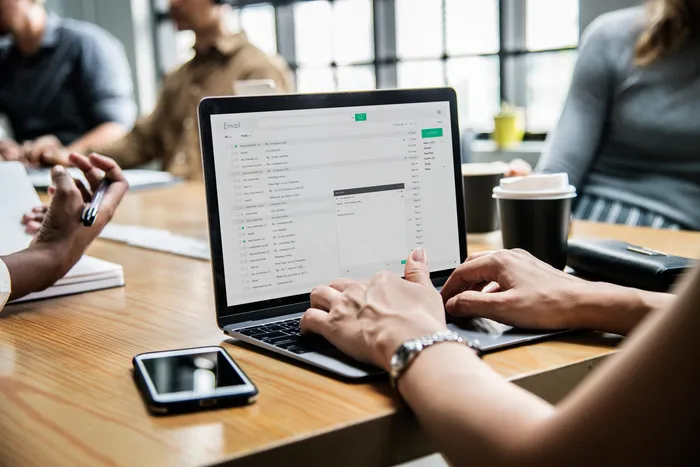
Multi-device programmatic deliveryCampaign performance management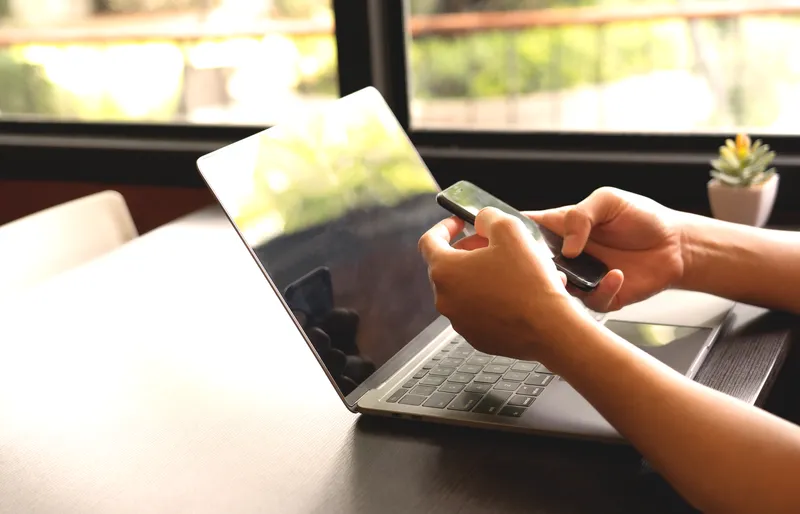
Custom GDPR-compliant solutionsSolutions to collect, enrich or re-engage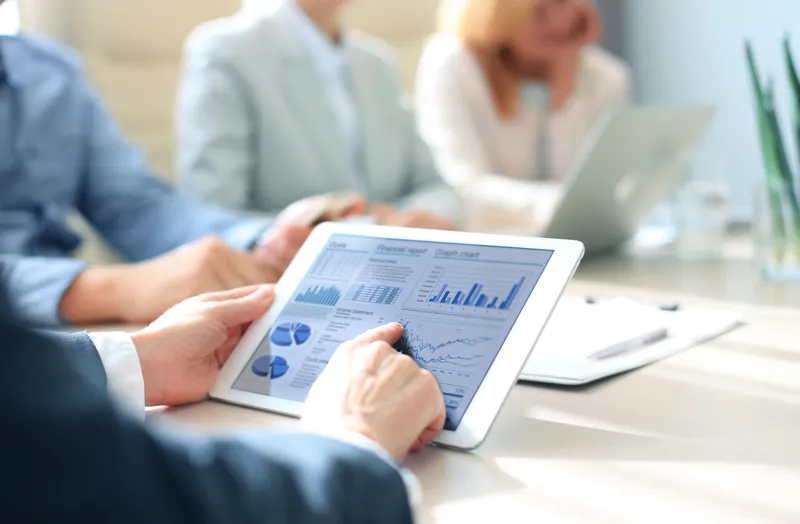
Tailor-made solutionsStrong presence beyond digital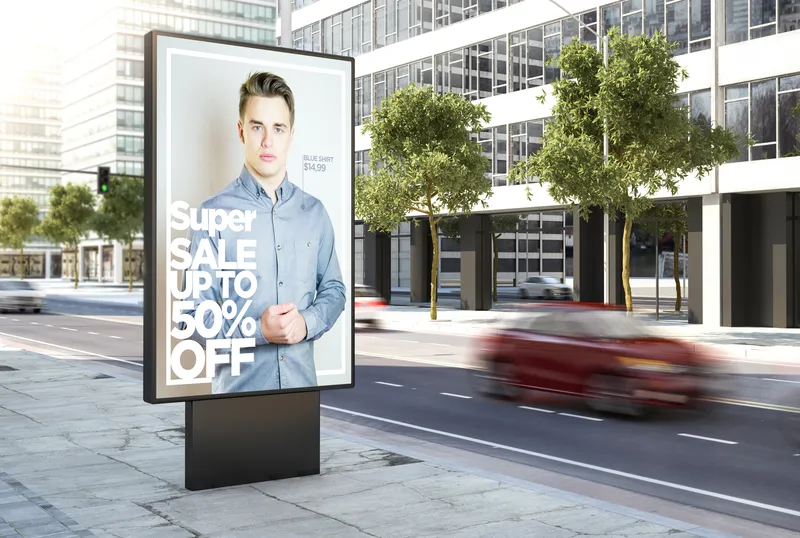
Brand awareness and conversion campaignsCarefully selected partner networks
19 years of expertise
Specialists in digital performance marketing since 2006.
+20 million actionable profiles
Exclusive, affinity-based, and activable data.
60 clients supported in 2024
An expert approach, adapted to all sectors and objectives.
Senior media & consulting experts
A team of media buyers and senior consultants dedicated to your performance.

Our strategic vision
At R-Advertising, we build tailor-made strategies designed to maximize your visibility, drive traffic and convert effectively.
Thanks to our dual media network & agency expertise, we support you at every stage: media planning, channel activation and ongoing performance optimization.
Our omnichannel approach allows us to reach your audiences at key moments, combining branding, acquisition and engagement. The result? Precisely managed campaigns, optimized investments and measurable impact on your growth.
AI-powered campaign activation
We integrate artificial intelligence at every stage of our activations: predictive targeting, creative optimization, real-time performance analysis and message personalization.
AI is not a standalone service at R-Advertising, it is an accelerator embedded across all our channels, delivering campaigns that are more precise, faster and higher-performing.
Ils nous font confiance
A super responsive team, always listening to our needs and proactive with suggestions.
We have been working with R-Advertising for several years and have always been very satisfied.
We have relied on R-Advertising's expertise for our email marketing activations for several years.
Their strategic expertise, proactivity and responsiveness directly contributed to achieving our goals.
We are very satisfied with the collaboration with R-Advertising.
Mélanie, Julien and the whole team are always attentive and very responsive.
The results are there, their support is real, and the human relationship is genuine.
I can only commend the consistent quality of their support.
Personalized support, responsive, with continuous improvement.
This experience was particularly positive. Beyond professional skills, the team shows great listening ability.
Constantly improving results on this channel throughout the seasons.
Jacadi has been working with R-Advertising for over 5 years and the results are always there.
Always straightforward and effective communication!
Great responsiveness, a performance-driven approach, and results.


Blog
Marketing news, insights... read our latest articles: